


Mike McCaffrey

Isaac Holy Ogwal


Advanced Liquidity Management:
While liquidity management is consistently cited as one of the most challenging elements of managing an agent network, there are times when it is more difficult than others. People’s need to deposit, withdraw and send value fluctuates quite considerably, and so while an agent might understand how much e-float and cash to carry on an average day, that still means that on high volume days, they, and therefore the entire system, are exposed to having inadequate stocks of value.
In Uganda and Kenya agents rank the “fluctuations in client demand” as the greatest impediment to float management, and in Tanzania it is ranked second (out of seven possible major impediments). Ironically, providers are usually already analyzing transactional data and know exactly when and why many of these fluctuations are occurring.
So what is the problem?
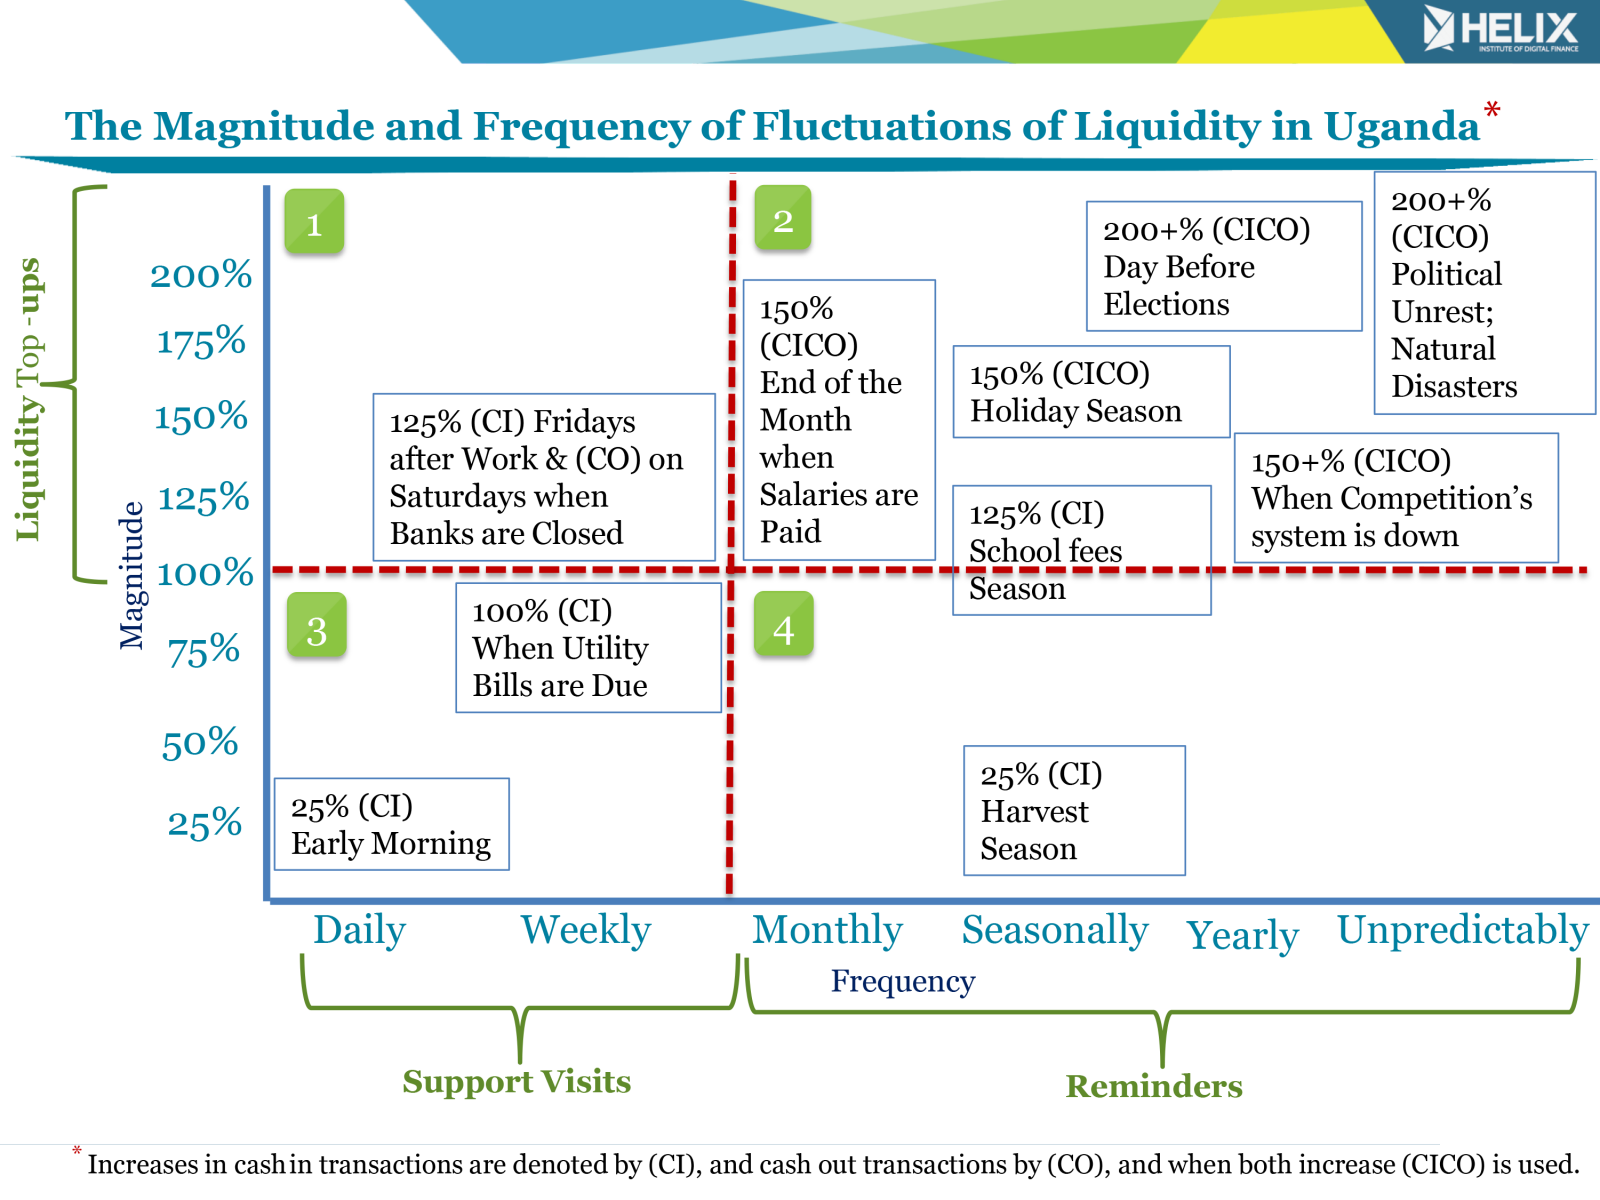
The answer really depends on which type of fluctuation in demand is causing problems and how the provider has developed systems to manage them. Foremost, agent network managers need a system for monitoring float and cash levels, which can start gathering this data for them. For predictable fluctuations, the two important dimensions of analysis are 1) the magnitude and 2) the frequency of the fluctuation. Understanding how the dimensions interact is important to selecting the proper solution for them. Below, the chart maps different fluctuations in client demand based on their magnitude and frequency. We interviewed the major providers in Uganda to illustrate these drivers, but as discussed below, providers will have to make their own chart for their own roll-outs.
Advice for Addressing Fluctuations:
Agent Support: All leading agent networks have a support system where agents are visited regularly to check on their business, but also to provide them with market information. This is when the drivers of fluctuations in demand need to be clearly explained, so agents understand when more extreme levels will occur. We recommend focusing on the extra commissions they can earn if they are prepared, because a two-fold increase in demand usually translates to a similar increase in revenue for them, and that is what will pique their interest.
Further, a more sophisticated reward structure can also be developed around motivating agents who prepare themselves by increasing their liquidity holding to better manage these fluctuations. This is going to work best for drivers in quadrants one and three, where events are frequent enough for the agent to remember them.
Agent Reminders: For drivers that occur more infrequently, say less than monthly (quadrants two and four), even if these occasional drivers are explained during support visits, agents will still need reminders to prepare. SMS campaigns and call centers can be used to give agents a friendly reminder of the business opportunities approaching. These can be done in two rounds, a week before the event, and then again the day before the occurrence.
Liquidity Top-ups: Regardless of the frequency of the occurrence, the magnitude is also important, since an agent can potentially be aware of an upcoming fluctuation, but just not have access to the capital to provision for it. These drivers are shown in quadrants one and two, and are in need of special attention.
Some providers and master agents have developed stronger relationships with key agents and provide these agents with float on credit. These top-ups should be easy to access, have reasonable interest rates, and short terms for repayments, usually less than a month, and sometimes the next day. It should be viewed like more of an overdraft than a loan. It may be a good idea to help your topped-up agents advertise that they have float during these high traffic events, which will help signal to your customers where they can easily transact.
Developing Your Own Diagram:
Unfortunately one cannot just copy and paste this framework from Uganda. There will be different drivers in your ecosystem that will happen on different frequencies and definitely with different magnitudes. Further, where these divisions occur (the red-dotted-lines on our chart), will have to be monitored for your individual roll-out and will depend on the character and structure of your network and individual agents. Decisions like minimum float levels, the level of monitoring of them, the time and money it costs agents to rebalance, and the quality of training and support services given to agents will all effect their ability to react to these fluctuations.
Practical First Steps Forward:
Look for these fluctuations in your transactional records, and talk to your agents regularly to find out when they are most struggling with high traffic days. Focus on fluctuations in transaction levels in the highest performing 20% of your network since these are much more likely to be agents that are preparing for these events, and actually doing more transactions during them. Compare these statistics to the performance of the rest of the network during these periods to gauge how many transactions you might be losing during these high demand periods where agents are unprepared. Use your support staff to ask about this in visits to low performing agents. Is it a result of the need for better education during support visits? Are agents aware but just forgetful; or are they simply unable to increase liquidity levels due to capital constraints?
Liquidity management is one of the hardest tasks in agent network management, but hopefully these simple tips can help increase transactions during the times when it is toughest, as those are also moments of great opportunity.