


Annabel Schiff

Mike McCaffrey


Tanzania is often cited as a model competitive market in digital financial services (DFS) with the three major providers healthily competing against one another. However, the story is a bit more complicated than that, and to really understand market dynamics in Tanzania it helps to examine competition from a few angles, and on a more granular level.
In markets dominated by Mobile Network Operators (MNOs), there is a basket of methods to measure competition on the provider level, however the most common are voice market share and DFS (mobile money/agent banking) customer market share. The first is important, because it indicates the ability of the provider (relative to its competitors) to transition people to their DFS platform (except in countries based on Over-the-Counter Transactions), and the second is important because DFS is an industry where scale is the only path to profitability, and at scale, a network effect can potentially create autocatalytic growth. However, here, we present a third method for measurement, which is the proportion of agents serving each provider in the field. This is an important contribution because it provides a metric for supply-side infrastructure that indicates how accessible the service is on the ground.
Figure 1: Three Metrics of Competitive Dynamics in Tanzania*
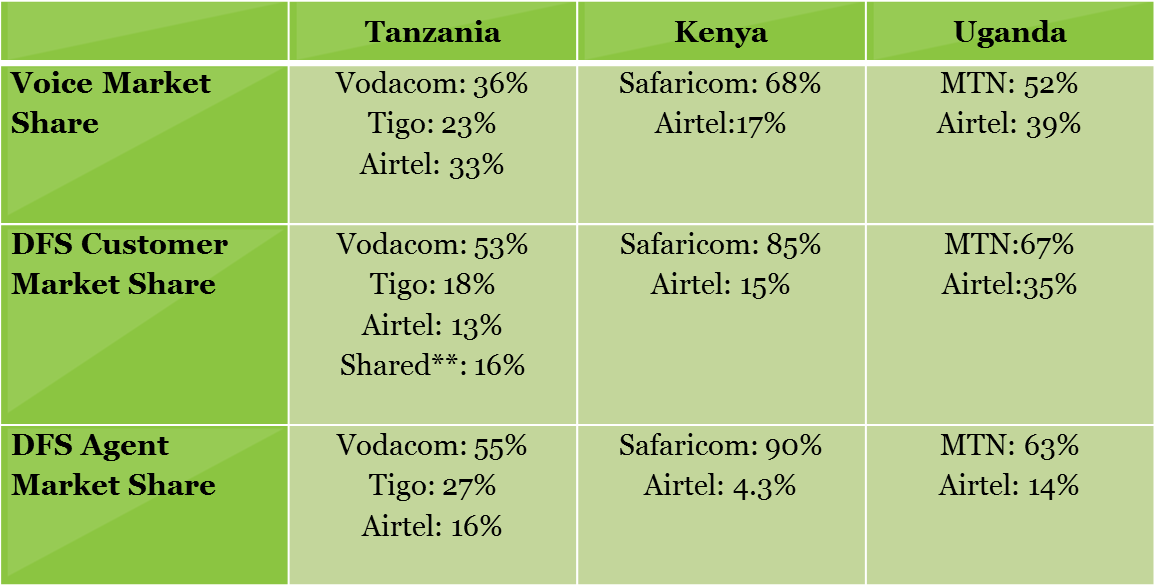
*Sources include: Communications Commission of Kenya, Uganda Communications Commission, Tanzania Communications Regulatory Authority, Provider’s websites and press releases and GSMA MMU research. Please note that these figures are best estimates. Also please note only figures from dominate providers are noted here and therefore numbers might not add up to 100%.
**This figure is reported by GSMA MMU, which represents customers who use multiple services. It is very likely that the majority of people in this category use Vodacom and one of the other services, meaning Vodacom’s market share might be underrepresented here.
Regarding voice market share, Tanzania is almost ideally competitive, and clearly more competitive than other East African markets, however, it is interesting that the relatively equal market shares in Tanzania do not translate to equivalent proportions of the market in the DFS space. Instead, market leaders have clearly accentuated market shares in Tanzania, Kenya and Uganda in the DFS space relative to the voice space. This is an indication that differences in resource allocations and levels of operational excellence make a big difference in the ability of a provider to translate success in the voice market to the DFS market.
Competition at the Agent Level:
Looking more granularly at DFS market share at the agent level, Tanzania has fiercer competition than Kenya and Uganda, meaning the market is more evenly distributed. However, with the Agent Network Accelerator research we filtered these results by location, and the analysis is intriguing, showing that competition in Dar es Salaam is especially intense, however, outside of Dar Vodacom Tanzania is just as dominant as MTN is in Uganda (see chart below). Further, we note that while only about 8% of Tanzanians live Dar es Salaam, about 30% of DFS agents are located there. Therefore, not only do providers have more equal footholds there, but agent density per capita is also highest, meaning the market is more saturated than in other regions of the country.
Figure 2: Agent Network Market Share Across The Three Leading DFS Providers in Tanzania, Uganda and Kenya
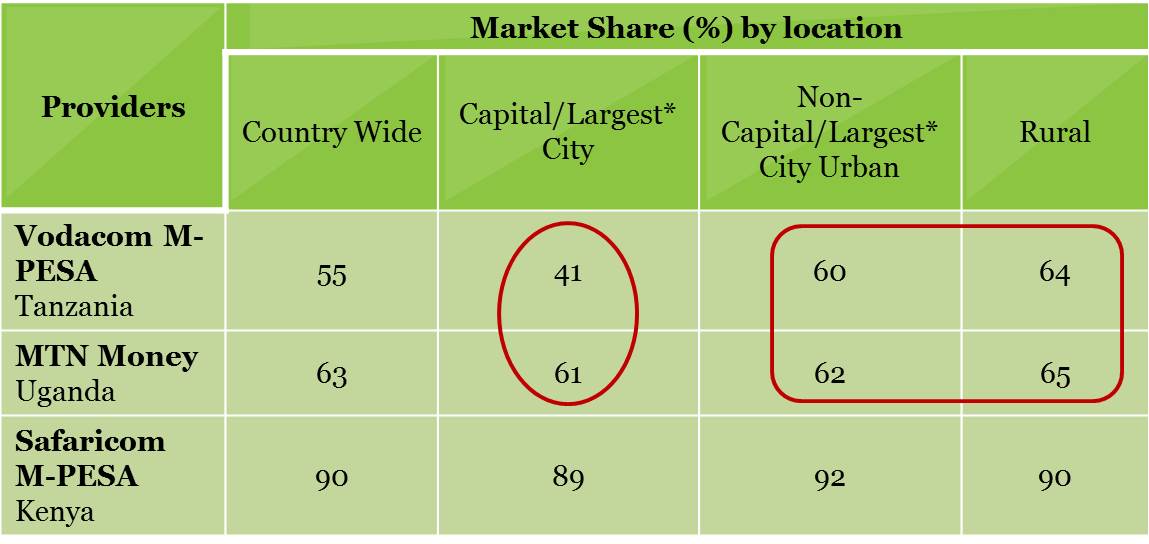
*In Tanzania Dar es Salaam was surveyed (largest city). In Uganda and Kenya we used the capital cities
Catalysing Shared Agents:
The highly competitive nature of Dar es Salaam resonates, as all providers have focused aggressively on that market, and to lesser degrees in the rural/non-capital (largest) city urban areas. However, the question remains as to what impact it has had on the development of the market itself. The most noticeable difference on the ground is the level of exclusivity of the agents, with 84% of agents in Dar being shared by providers, while the majority of agents outside of Dar remain exclusive, almost entirely to Vodacom.
This high level of shared agents was certainly facilitated by the initial competitive market shares of the providers in the voice markets, which meant that no one player had enough market power to force agents into exclusivity agreements. However, the small geographical concentration of non-exclusive agents in Tanzania makes it clear that even if there is the potential for shared agents across the country, aggressive investment in growing an agent network by multiple providers is still a necessary condition for non-exclusivity to thrive.
Figure 3: Exclusivity of Agents By Location – Tanzania*
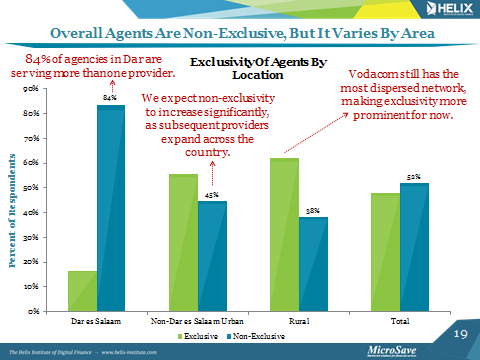
*Taken from Slide 19 of ‘Agent Network Accelerator Survey: Tanzania Country Report 2013’
The Profitable Result for Agents:
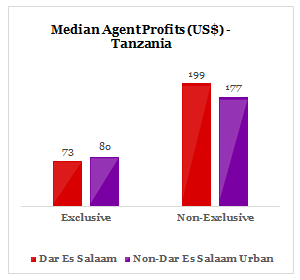
The ironic outcome for agents operating in the competitive, saturated market of Dar es Salaam, is higher profits per agent. However, this needs to be unpacked a bit, because Tanzania has higher profits overall versus Kenya and Uganda partly due to very low operational expenses. Again, when we delve into a locational analysis we see that Dar es Salaam is considerably more profitable for agents than other areas of the country. When we separate the locational variable of being in Dar es Salaam with the exclusivity attribute, it is clear that serving multiple providers is the factor that has a strong positive correlation with profit (as opposed to just being located in Dar). Therefore, we conclude it is likely the ability of agents to serve multiple providers, and therefore earn multiple revenue streams which drives higher profitability in Dar es Salaam.
Figure 4: Median Agent Profits Per Month – Tanzania, Uganda, Kenya
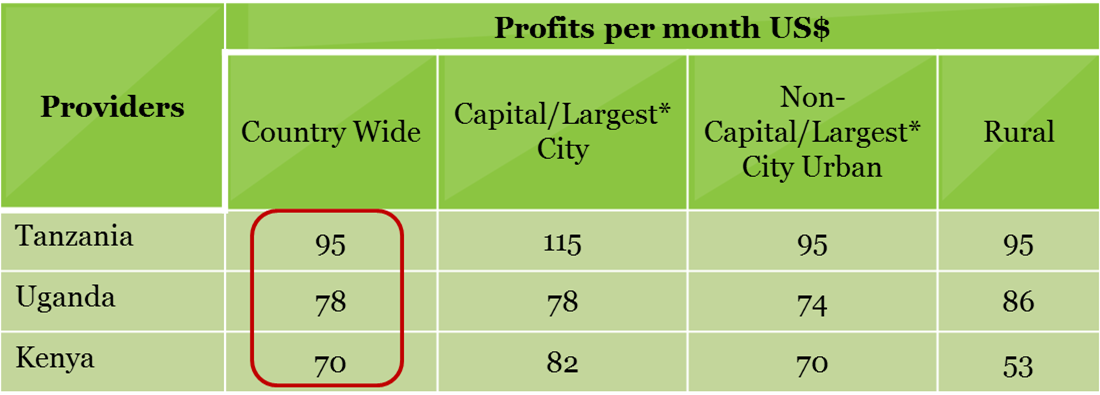
*In Tanzania Dar es Salaam was surveyed (largest city). In Uganda and Kenya we used the capital cities
Figure 5: Media Agent Profits Per Month – Tanzania
Conclusion
Although Tanzania has a competitive voice market, it has only translated to heighten competition in the DFS market in Dar es Salaam. While the data provided here can only show correlations, and not causation, combining it with qualitative interviews with agents and providers, a story does emerge. It seems that initial tight competition in the voice market enabled the development of a shared agent network in Dar es Salaam where the three market leaders all focused their efforts. The ability of agents to serve multiple providers increased their profits, as they were then able to collect revenue from multiple providers with minimal additions to their costs.
However, this dynamic has yet to spread beyond Dar es Salaam, where Vodacom remains just as dominant as MTN in Uganda. Currently, challenging providers have intensified their focus on other parts of the country, and given it continues, we expect the whole country to look more like Dar es Salaam with profitable shared agent networks in the near future.
To read either our reports in full, please download them using the links below:
Agent Network Accelerator Survey – Tanzania Country Report
Agent Network Accelerator Survey – Uganda Country Report
Agent Network Accelerator Survey – Kenya Country Report – COMING SOON!