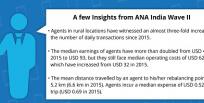


Vera Bersudskaya


DFS providers struggle with a variant on the chicken and egg problem: whether to recruit more agents or more customers? How to provide adequate access for customers while ensuring agents face sufficient demand? All are interested in striking the right balance. New research from The Helix Institute finds that to date we have overestimated the number of customers per agent required to ensure network viability in maturing markets.
Existing Industry Benchmarks
Until now, network management gurus (GSMA, McKinsey, The Helix Institute) referenced what has become a CGAP’s classic: the graph depicting the evolution of M-PESA customer to agent ratio in the early month after its launch in Kenya (Figure 1).
Figure 1. M-PESA Customer to Agent Ratio (2007-2009)
.png)
In 2013, GSMA further qualified the M-PESA benchmark. Using data from the Global Adoption Survey, it recommended a target ratio of 150 to 800 active customers per active agent. A new Helix study draws on 15 datasets to offer updated and more precise benchmarks for five leading DFS countries: Bangladesh, Kenya, Pakistan, Tanzania and Uganda. In this blog, we use a similar methodology[1] to examine provider-specific customer to agent ratios in these markets.
Registered Customers vs. Active Agents
In East Africa, customers generally need a registered account to use mobile money and providers set targets for new registrations. These must be balanced with agent acquisition. Using the latest data available for Kenya, Tanzania, and Uganda[2] we determine provider-specific registered customer to active agent[3] ratios for seven leading MNO DFS providers range from just under 100 to under 300 (Figure 2).
Figure 2. Distribution of Leading East African DFS Providers, by Registered Customer to Agent Ratio
.png)
Figure 2 shows that the bulk of East African leading providers have registered between 100 and 300 customers for each agent who has transacted at least once over the past quarter. This ratio is much lower than the initial M-PESA benchmark. In fact, looking at more recent M-PESA ratios, calculated using subscriber and agent figures reported in Safaricom annual reports, we find that for the past four years it has flattened out between 200 and 300 (Figure 3).
Figure 3. M-PESA Subscriber to Agent Ratio (2010-2016)
.png)
Registered customer to agent ratio will and should fluctuate during periods of expansion, as providers shift focus between on-boarding new customers and new agents. Nevertheless, benchmarks can help gauge whether growth is becoming too imbalanced. Importantly, provider and agent viability will vary even at similar registered customer to agent ratios, depending on product offering, customer activity rates, and commission structures. Thus, customer to agent ratios should not be targeted in a vacuum.
Active Customers vs. Active Agents
Because a large proportion of customer accounts are inactive, we also examine the ratio of active customers[4] to active agents for 16 providers in the five leading markets (Figure 4). Naturally, these ratios are much lower than the ones in Figure 2.
Figure 4. Distribution of Main DFS Providers in Five Leading Markets
.png)
Plotting active customer to active agent ratios in the most dynamic digital finance markets helps update and narrow the target range from 150-800 down to 100-300. Some factors that affect these ratios include DFS take-up and usage rates. Higher levels of dedication would translate into the ability and need to accommodate greater numbers of customers because dedicated outlets focus exclusively on serving mobile money clients. High agent churn could lower the ratio as less experienced agents tend to serve fewer customers, or increase it if outlets going out of business are not immediately replaced. While proposing benchmarks amidst this complexity is a tricky affair, we find the 100-300 range more useful than the guidance available up to now.
Ratios vs. Agent Performance
To further hone in on the viable range of active customer to active agent ratios, we have plotted them against agents’ daily business volumes (Figure 5).
Figure 5. Agent Business Volume vs. Active Customer to Active Agent Ratios
.png)
NOTE: One provider’s data is included in the analysis but not shown as its unique values would have revealed its identity.
Some sixteen data points only indicate a trend, but Figure 5 presents a fairly clean and strong one. Interestingly, providers with a ratio of 84 or higher perform a median of ten transactions or higher. Therefore, we can make a tentative conclusion that to keep median daily transactions above ten, the ratio of active customers to active agents should fall roughly within the 100-250 range, depending on commission rates, agent density and other variables like transactions per active customer.
Conclusion
In nascent markets, customers transact less often than those in more mature markets, where customers have developed trust in the DFS systems and enjoy a wide range of opportunities to transact. The above analysis suggests that in “lift-off stage” of deployment providers may aggressively recruit customers to drive demand for their service. This, in turn, allows them to further expand the agent network. As DFS take-up and usage rates intensify and the deployment reaches its “orbit stage”, the ratio of customers to agents will eventually flatten out, at a much lower range of 100-300 than the 400-600 benchmarks the industry has been using until now.
[1] We combine data from IMF and World Development Indicators with nationally representative Agent Network Accelerator (ANA) and Financial Inclusion Insights (FII) surveys to calculate provider-specific number of active agents as well as registered and active customers. See Appendices III, V, VII and IX in Agents Count.for a more detailed explanation.
[2] Analysis is based on the latest data available, which is 2014 for Kenya and 2015 for Tanzania and Uganda.
[3] Active refers to agents who have conducted at least one transaction in that past 90 days. Bank of Tanzania statistics on activity rates are used as best available proxy for Kenya and Uganda.
[4] Active customers are defined as having performed a financial transaction using mobile money in the past 30 days.